Diagram-as-Code
Keep it simple!

Introduction
In the world of software engineering, keeping architecture diagrams up to date can be a challenge. As systems evolve, diagrams often fall out of sync with the actual code, leading to miscommunication and confusion. This is where Diagram-as-Code comes in — an engineering practice that allows you to automatically generate and maintain diagrams directly from source code or domain-specific languages (DSLs). It allows you to track the architecture diagram changes in any version control system.
In this post, I’ll explore a few tools that can help streamline your workflow, ensure accurate documentation, and save you time.
1. Mermaid
Mermaid is a JavaScript-based diagramming and charting tool that renders Markdown-inspired text definitions to create and modify diagrams dynamically.
It integrates seamlessly with IntelliJ, VSCode, and GitLab.
Website: https://mermaid.js.org/
Mermaid playground: https://mermaid.live/
Example (DSL)
```mermaid erDiagram CUSTOMER }|..|{ DELIVERY-ADDRESS : has CUSTOMER ||--o{ ORDER : places CUSTOMER ||--o{ INVOICE : "liable for" DELIVERY-ADDRESS ||--o{ ORDER : receives INVOICE ||--|{ ORDER : covers ORDER ||--|{ ORDER-ITEM : includes PRODUCT-CATEGORY ||--|{ PRODUCT : contains PRODUCT ||--o{ ORDER-ITEM : "ordered in"## GitLab Branching 

2. WebSequenceDiagrams
WebSequenceDiagrams is an online tool that allows you to create simple, visual sequence diagrams.
The tool lets you write text-based descriptions of interactions in a lightweight markup language, then automatically generates a visual diagram based on that text.
It’s perfect for quickly illustrating workflows and system interactions.
Website: https://www.websequencediagrams.com/
Example (DSL)
title AWS - HighLevel Architecture! User ->Route53: <color:#bl>**DNS</color> Route53 ->CloudFroint: <color:#blue>**CDN</color> CloudFroint->ELB: <color:#purple>**Load Balancer</color> ELB->Nginx+: <color:#green>**Ingress Controller</color> Nginx+->EKS: <color:#red>**Microservices</color> EKS->RDS: <color:#red>**Data (R/W)</color> 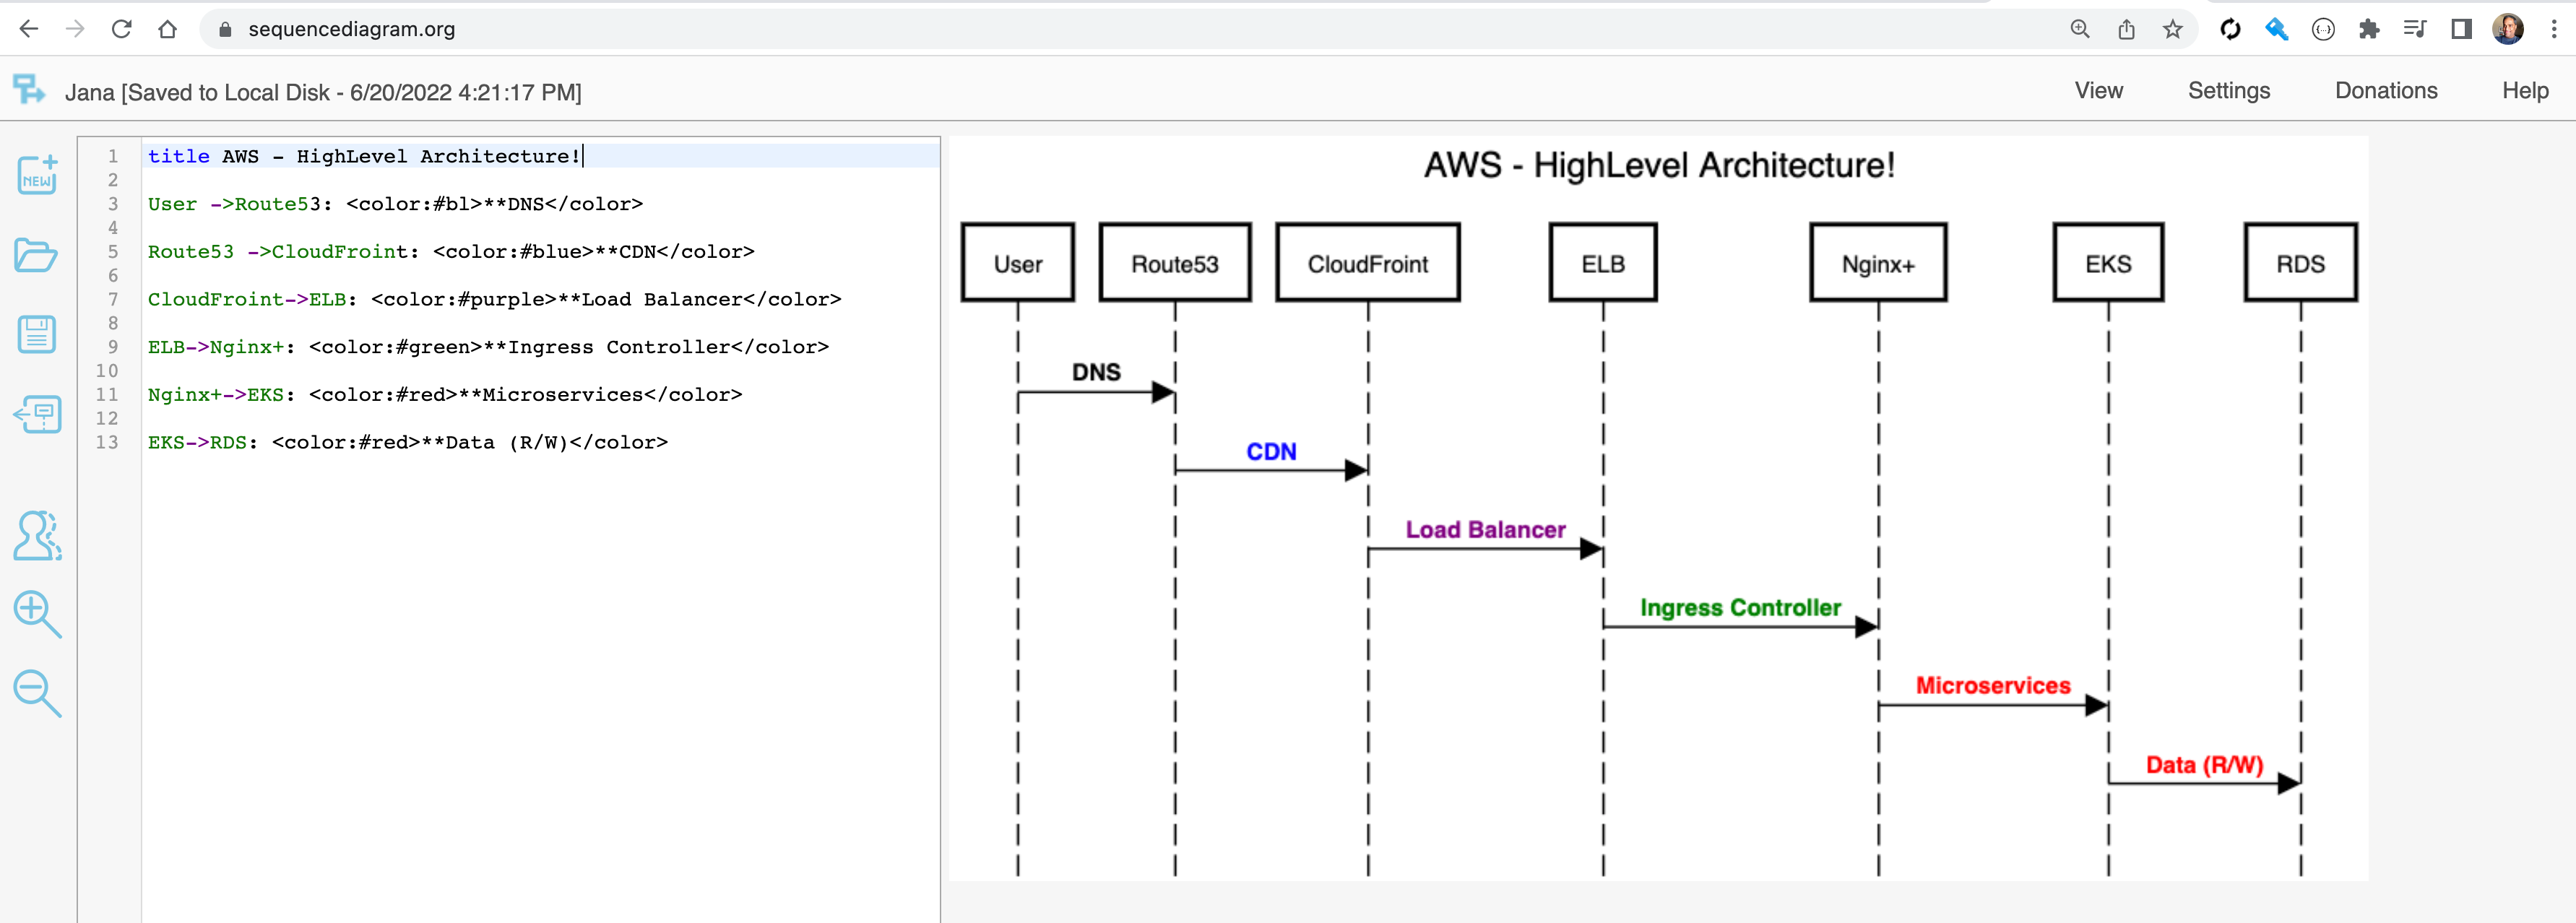
3. Ilograph
Ilograph lets you create rich, interactive diagrams to document, share, and explain your systems with incredible clarity and detail. It’s one of my favorite tools.
Ilograph Desktop is perfect for organizations and individuals that want to store their diagrams locally and/or wish to use Ilograph without internet access or behind firewalls.
Website: https://www.ilograph.com/
Demo: https://app.ilograph.com/demo.ilograph
Example (DSL)
# YAML imports: - from: ilograph/aws namespace: AWS resources: - name: Ilograph Web subtitle: Web Application description: Advanced diagramming web application for creating interactive, multi-perspective diagrams in the browser icon: _demo/ilograph.png perspectives: - name: Request color: Firebrick relations: - from: Ilograph Web to: diagram label: Requests description: The Ilograph web app uses the */diagram* resource of the *ilographV0* REST API ...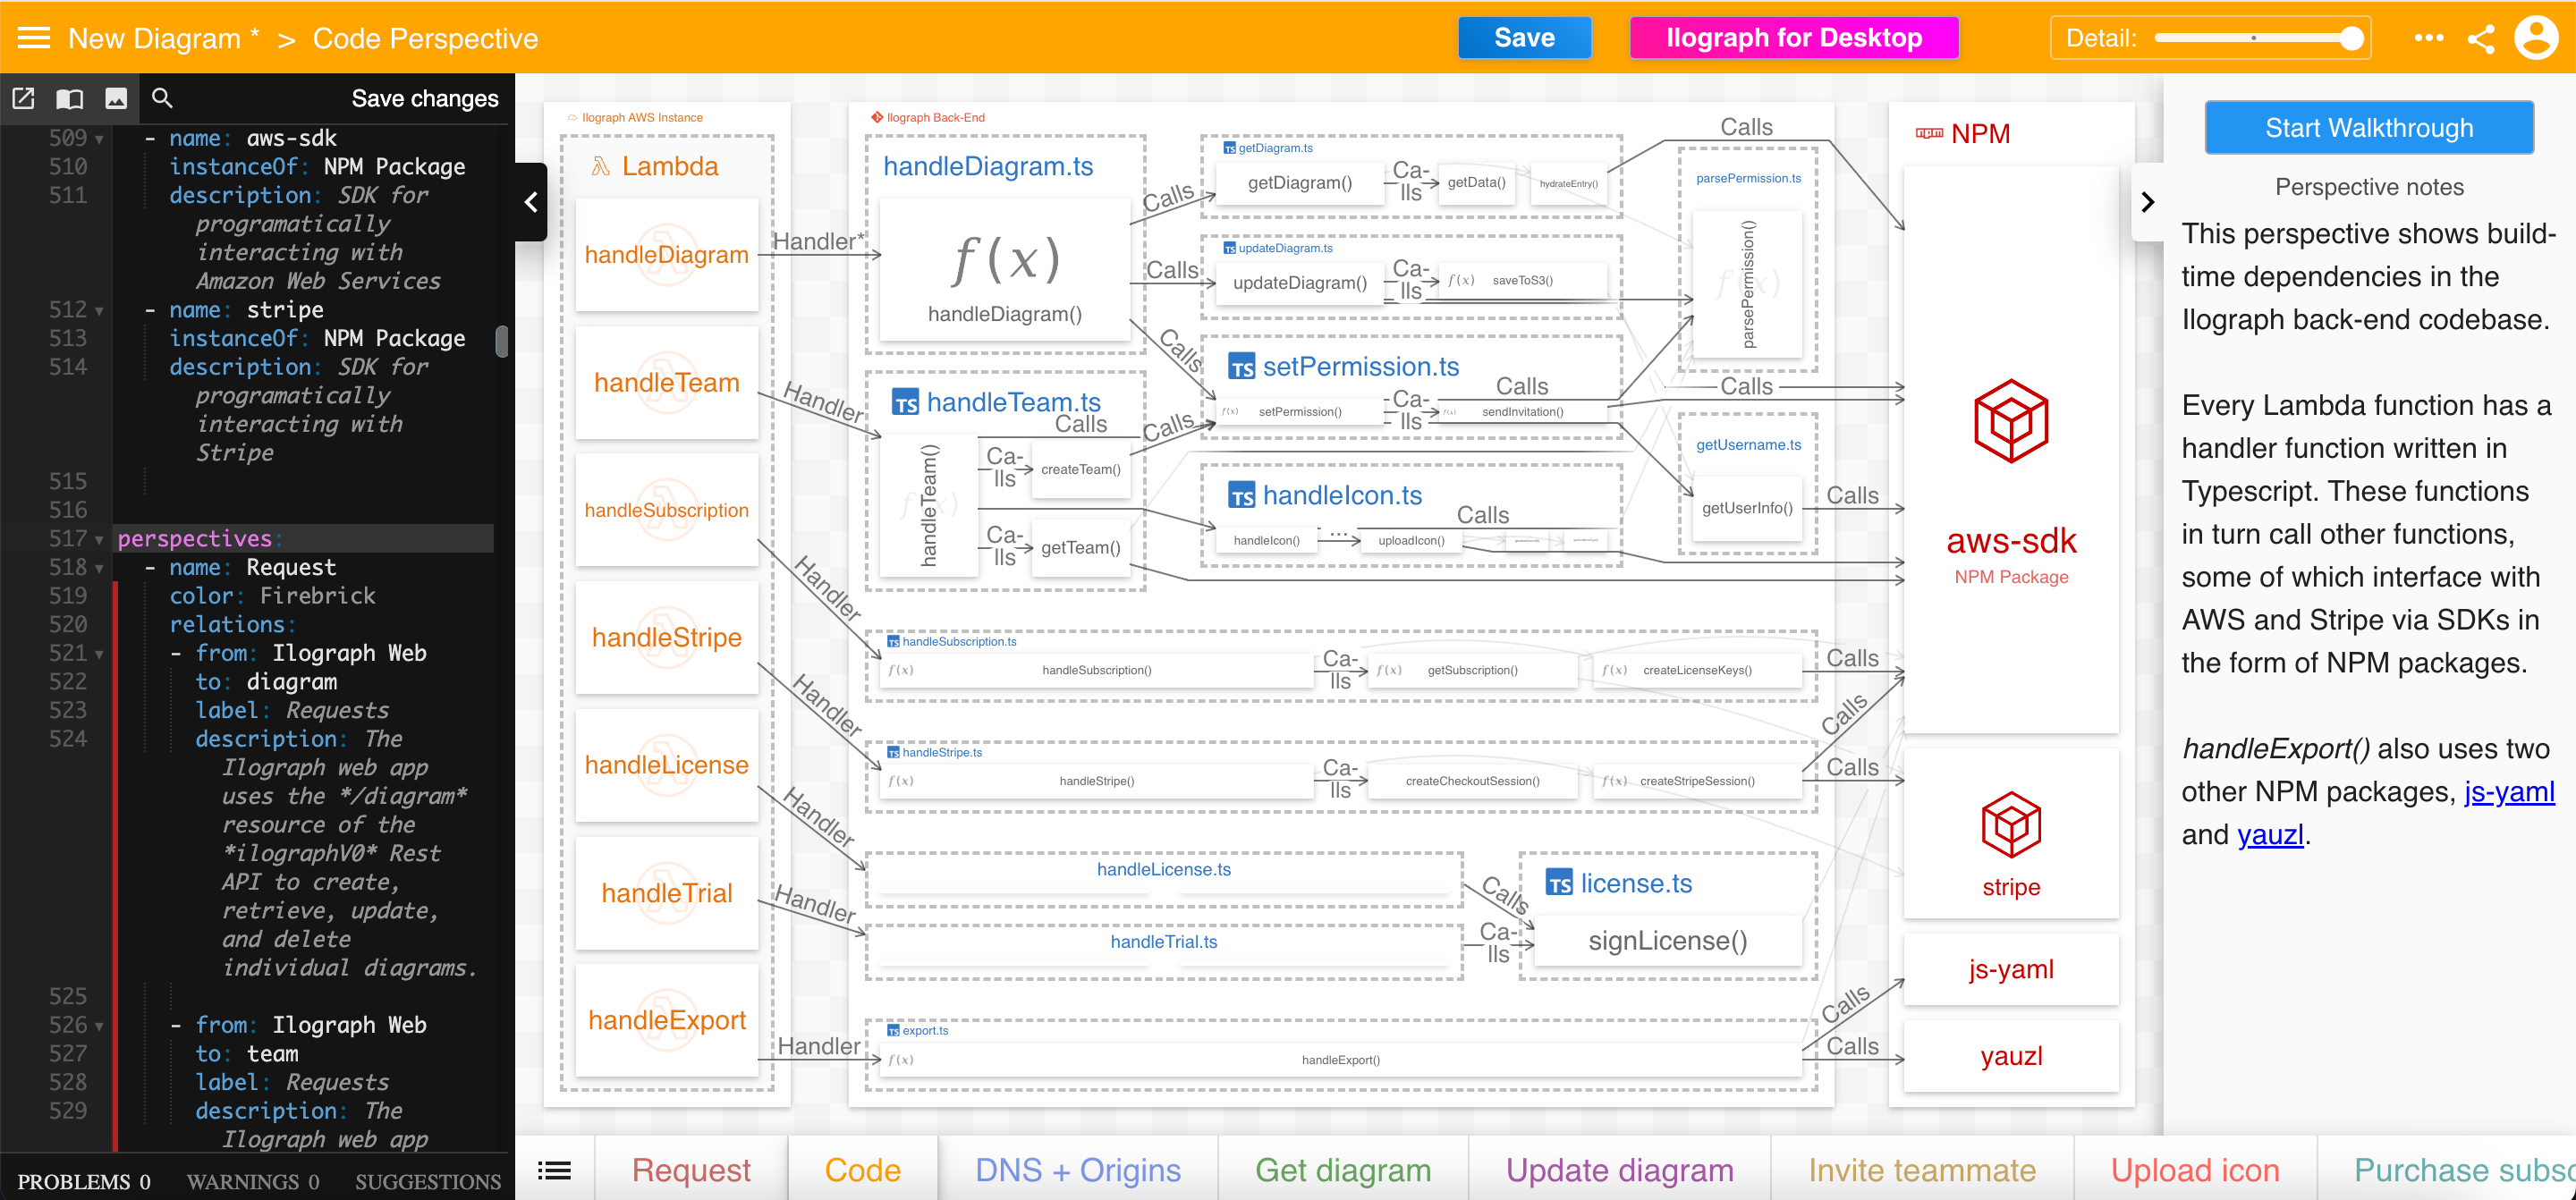
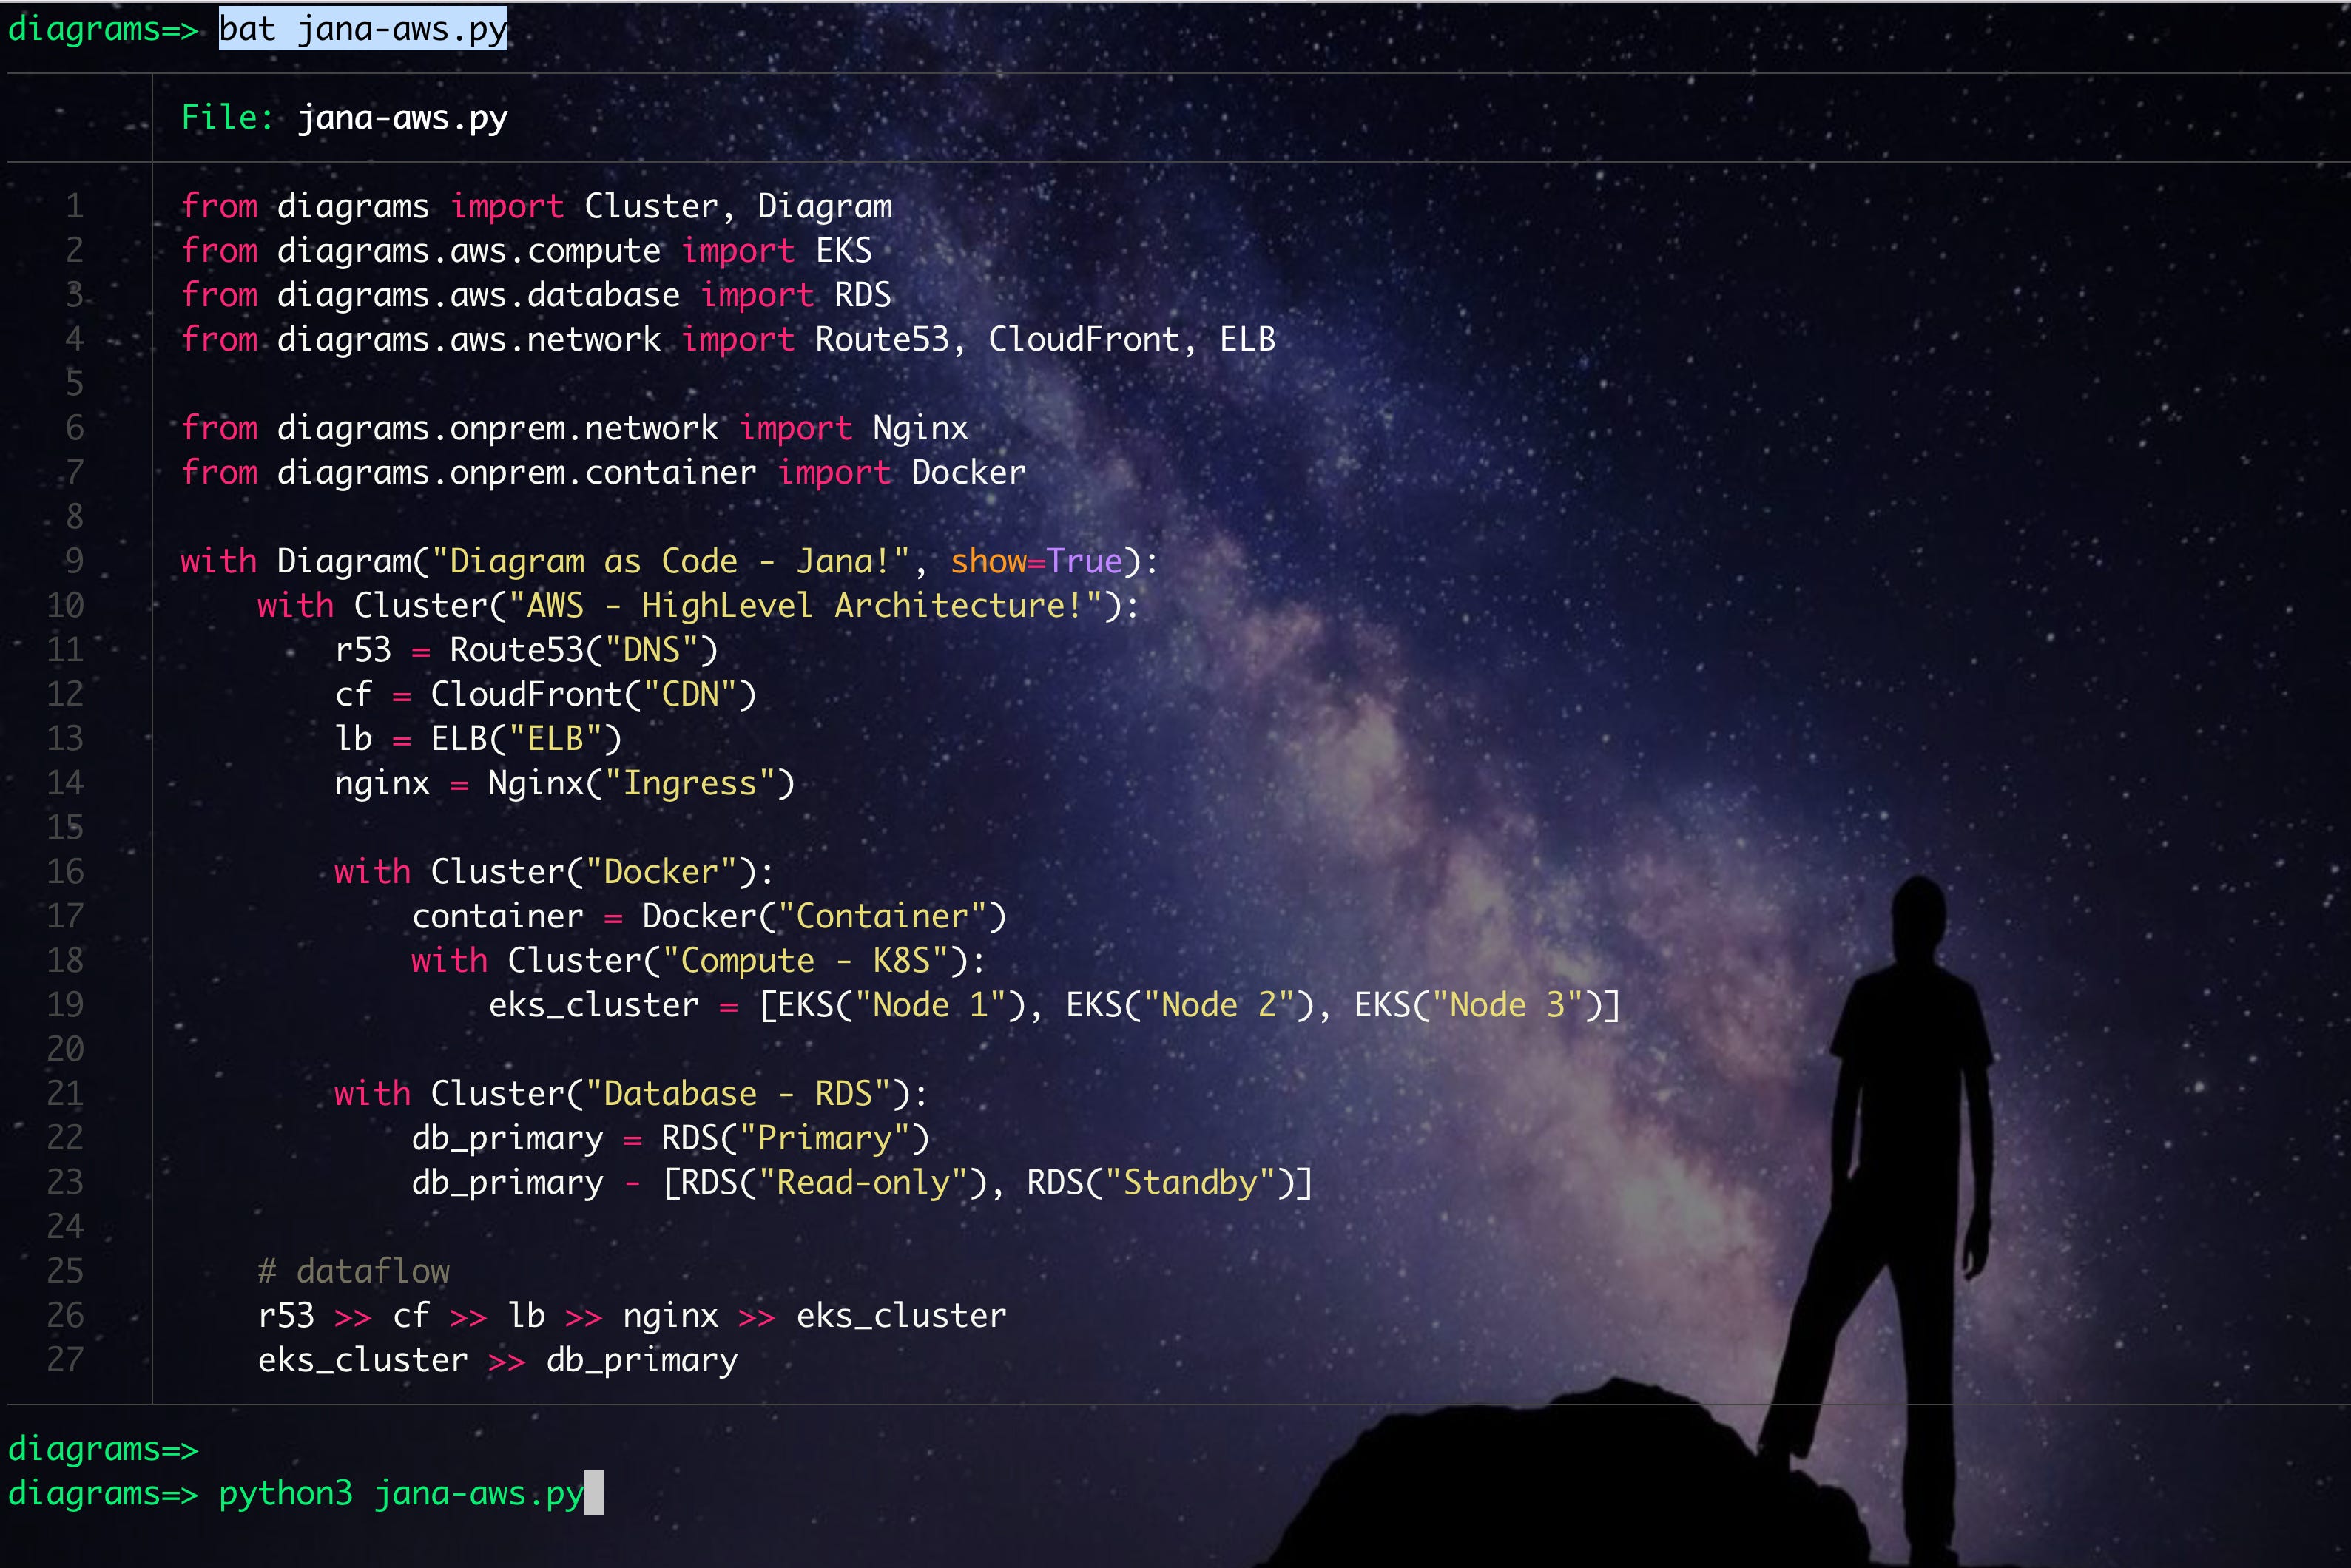
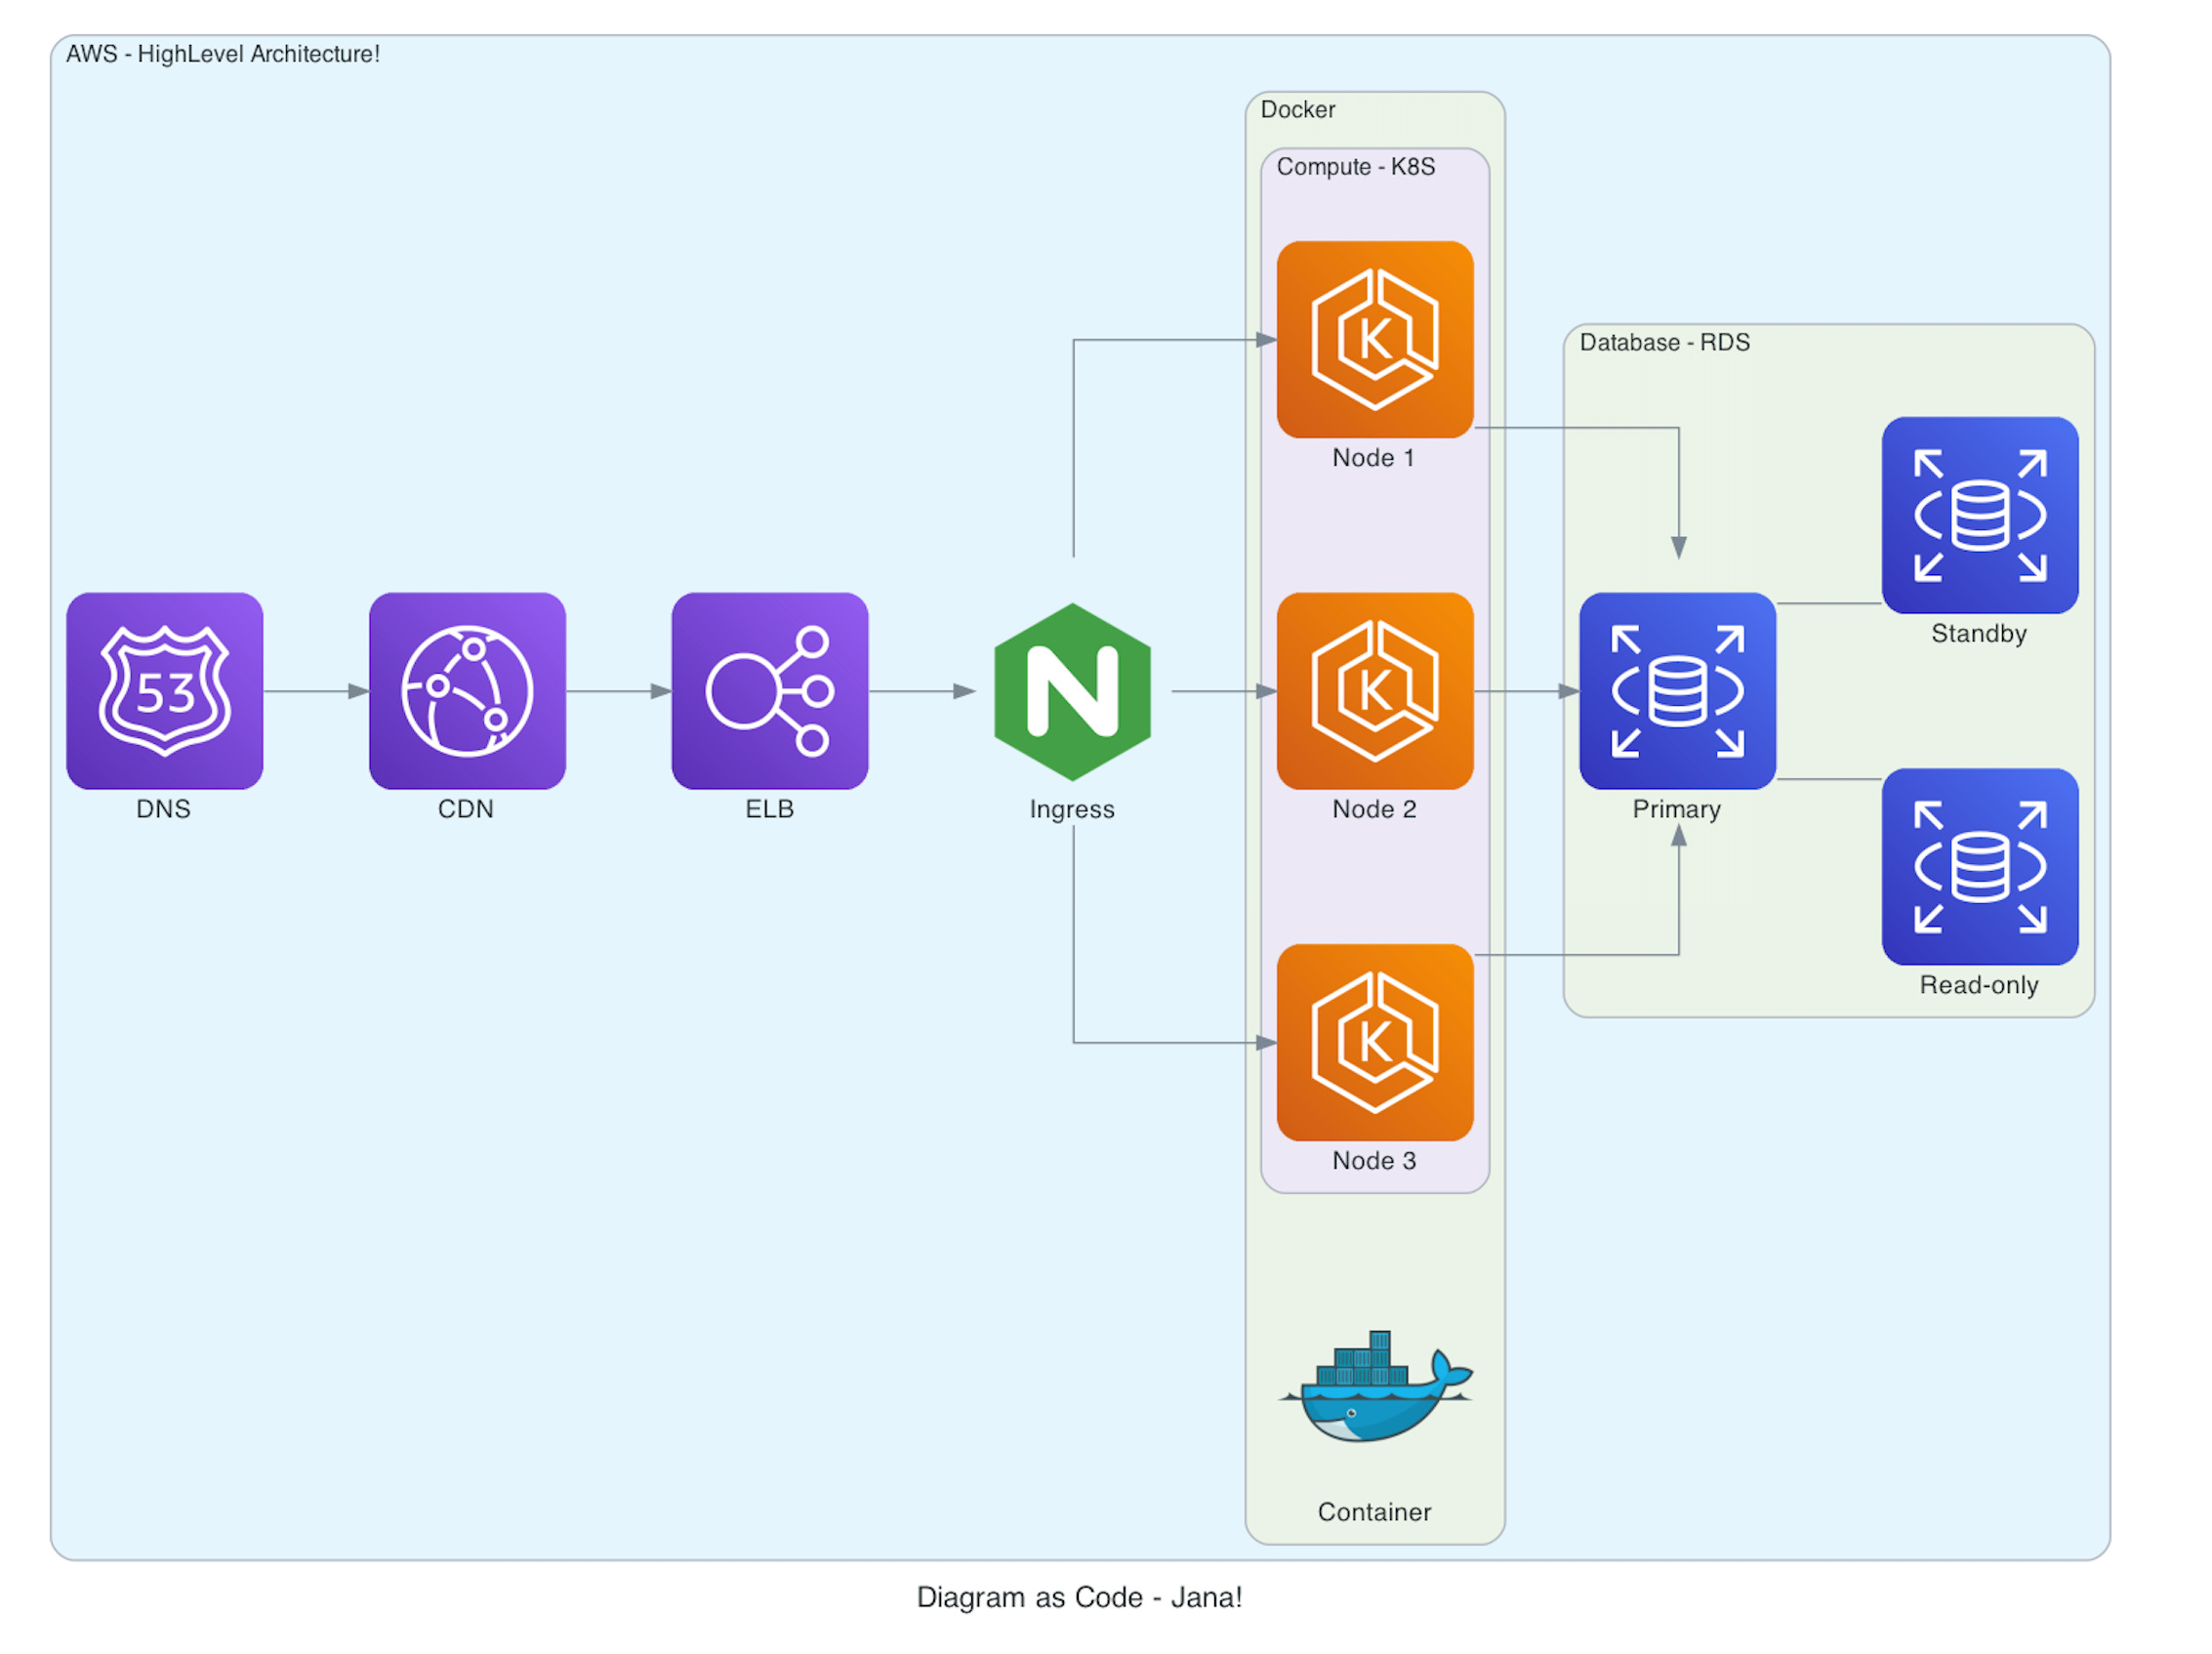
4. Diagrams
Diagrams lets you draw the cloud system architecture in Python code.
It currently supports main major providers including: AWS, Azure, GCP, Kubernetes, etc.
Website: https://diagrams.mingrammer.com/
Example (Python)
Final Thoughts
Diagram-as-Code helps keep your architecture diagrams in sync with your code, saving time and reducing errors.
The tools mentioned above make it easy to create and maintain accurate diagrams, improving communication and streamlining your workflow.